Archive
Don’t care how, I want it now!
Janet Barresi needs to resign – yesterday. Tomorrow would be fine too. Hell-bent on exacting her wrath, she continues to be an embarrassment to the state of Oklahoma.
As you know by now, she has created a new assistant superintendent position over accreditation and hired the SDE’s lawyer’s husband to fill it. This man has nearly 40 years experience in law enforcement, but none in public education. Yet he’s going to help school districts stay in line with all the state mandates. And oh, there are many. Here is an overview of information that state accreditation officers have sent to schools regarding upcoming deadlines and reporting requirements. Keep in mind that this is just for October.
OCTOBER 2014
S Prior to October 1 superintendents shall designate Test Coordinators for the district and all buildings; names, email addresses and telephone numbers of District Test Coordinators (DTC) shall be provided to the SDE Office of Assessments in the fall semester of each school year; Assessments (405) 521-3341. [OAC 210:10-13-4]
S Each district shall send a District Test Coordinator and all building coordinators to the Oklahoma School Testing Program (OSTP) Test Preparation inservice sessions; Assessments (405) 521-3341. [OAC 210:10-13]
S Advanced Placement Grant applications available; Advanced Placement (405) 521-4288.
S Submit Annual Student Dropout Report to local board of education in October or November; Alternative Education (405) 522-0276. [OAC 210:35-25-3]
F IDEA Special Education Child Count: Prepare and begin data entry for IEP students enrolled in your district on October 1, 2013; Special Education (405) 521-3351. [70 O.S. § 18-200.1] and [70 O.S. § 18-200.1(E)]
Due Date
1 S Historical Graduation Cohort Report is available via the WAVE, contingent upon the completion of the Comprehensive Exit Report and Fourth Quarter Dropout Report; Accountability (405) 522-5169. [OAC 210:10-13-22]
1 S Begin preparing site data to be used in the Annual Accreditation Application via the Single Sign-On; Accreditation (405) 521-3333. [70 O.S. § 18-113.3]
1 F Submit annual Limited English Proficiency (LEP) Student Survey online; Bilingual Education/Title III (405) 522-6249. [Title III NCLB § 3121 (a)]
1 F Verification process of Child Nutrition Programs free/reduced price applications must begin; Child Nutrition Programs, (405) 521-3327. [7 CFR, Part 245]
1 S Submit one copy of either the Estimate of Needs or the Budget (for those districts on the School District Budget Act) to SDE and the County Excise Board; Financial Accounting/OCAS (405) 521-2517. [70 O.S. § 5-128.1; 68 O.S. § 3002]
1 S Local Advisory Committee on Gifted Education must convene/meet or have convened/met; Gifted and Talented (405) 521-4287. [70 O.S. § 1210.308]
1 S Submit Reading Sufficiency Act student count; Reading/Literacy (405) 522-3219, or (405) 522-3241. [70 O.S. § 1210.508C]
1 S Deadline for submitting Initial Certified Personnel Report and Initial Support Personnel Report via SDE web-site, Single Sign-On; School Personnel Records (405) 521-3369. [OAC 210:27-1(2) (1); OAC 210:25-3-4(e)] [70 O.S. § 18-200.1]
1 S Local board of education shall prepare a schedule of salaries and fringe benefits paid to administrators, including a description of the benefits, for any superintendent, assistant superintendent, principal, and assistant principal in both “teaching” and “nonteaching” positions (submitted as part of the Initial Certified Personnel Report); School Personnel Records (405) 521-3369. [70 O.S. § 5-141(C) (D)]
1 F Child Count for IDEA Special Education; Special Education Services (405) 521-3351.[70 O.S. § 18-200.1 and 18-200.1(E)]
1 S Class Size Audit forms are available via the SDE Single Sign-On Reporting Site; State Aid (405) 521-3460. [70 O.S. § 18-113.1] (Class size audits will no longer be required of the districts.)
1 S First Quarter Statistical Report (FQSR) is available to school districts via the SDE Single Sign-On reporting site; State Aid, (405) 521-3460. [70 O.S. § 5-128]
3 F Homeless Census Report; Federal Programs Title X/Homeless Education (405) 521-2846. [NCLB P.L.17-110]
5 S Fourth Quarter Student Dropout Report for 7-12 grades, by site, is required to be submitted by all public schools via the Wave; SDE accredited private/parochial schools are required to report via the Single Sign-On submitted by a superintendent, principal or head teacher; Alternative Education (405) 522-0276. [70 O.S. § 35e]
10 S ACE Exemptions/Exceptions Report, high school only; ACE/Counseling (405) 521-3549
10 S District ACE Remediation Report due via SDE School District Reporting Site; ACE/Counseling (405) 521-3549 [70 O.S. § 1210.522]
10 F Claims for reimbursement for lunches, breakfasts, snacks, and/or milk (Special Milk Program) served during previous month; Child Nutrition Programs (405) 521-3327.
[7 CFR, Part 210.8 (b)]
10 S OPAT Monthly Data Report, Special Education Services; (405) 522-4513.
11 F Deadline for entering the Special Education October 1st Child Count without penalty; Special Education (405) 522-1463. [70 O.S. § 18-200.1]
15 S No later than October 15, the district’s annual Accreditation Application to the State Board of Education must be certified online by the district superintendent; Accreditation (405) 521-3333. [70 O.S. § 3-104]
15 S No later than October 15, any district application for a Statutory Waiver or a Deregulation that is for the span of the entire school year, must be submitted; Accreditation (405) 521-3333 [70 O.S. § 3-126]
15 S No later than October 15, the Wave Comprehensive Exit Report is due certified by the District Superintendent; SDE Customer Service (405) 521-3301, or Office of Student Information (405) 521-4892.
15 S No later than October 15, the Wave October 1 Consolidated Report is due certified by the District Superintendent; SDE Customer Service (405) 521-3301, or Office of Student Information (405) 521-4892.
15 S Preferred date to renew Advanced Placement courses with College Board; Advanced Placement (405) 521-4288.
15 F Fresh Fruit/Vegetable Program claim for reimbursement for fresh fruits and vegetables served during the previous month; Child Nutrition Programs (405) 521-3327. [7 CFR, Part 210.8(b)]
15 S Child count report due for Gifted Educational Plan Update and Summary Budget; Gifted and Talented (405) 521-4287. [70 O.S. § 1210.307]
15 S Prior Year Noncertified Teachers deadline for response; School Personnel Records (405) 521-3369. [OAC 210:25-3-4(b)]
15 S Deadline for Driver Education Application for Prior Year Reimbursement; State Aid (405) 521-3460. [OAC 210:15-19-6]
19 S Student Dropout Report Re-entry Checklist due; Public schools submit via the Wave Fourth Quarter Dropout Report; Private/parochial schools submit via Single Sign-On; Alternative Education (405) 522-0276. [70 O.S. § 35e]
21 F Computer-generated school district expenditure reports are due; Federal Programs (405) 521-2846, or School Support/School Improvement (405) 522-3395.
30 F Submit annual Limited English Proficient (LEP) Student Survey online; Bilingual Education/Title III (405) 521-3196. [Title III, P.L. 103-382, § 7134]
31 F Civil Rights Compliance Checklist – Report must be completed and maintained in school district files; Child Nutrition Programs (405) 521-3327. [7 CFR, Part 210.23(b)]
For anyone who has never seen a list like this, it’s something that superintendents and other administrators see each month. The number at the beginning of the line is the day of the month that the information applies. The “S” or “F” after the number refers to whether the requirement is state or federal. The bracketed information at the end of the line refers to the statutory or regulatory foundation for the requirement.
Again, this is just for one month, albeit one of the busiest reporting months of the academic year. Still, some guy with no public school background is going to help schools through this process? Not likely.
A reader sent me some insight yesterday that I found hilarious. At some point during Barresi’s administration, apparently it has been suggested that Regional Accreditation Officers should get badges and sidearms. Can you imagine an RAO showing up in your superintendent’s office, casting a shadow in the doorway, tapping his/her holster suggestively, and asking ala Clint Eastwood, Where’s your GT Child Count? Punk. Better yet, would your RAO pull a John Wayne while inspecting your school’s Child nutrition records, Got Milk, Pilgrim?

A gun and a badge would just be a costume. Logic would dictate that your RAO isn’t going to use either in any meaningful way. Instead, we would be taking a group that tries to help schools and turning them into a caricature. Speaking of which, I should probably get back to discussing our state superintendent.
Yesterday, at the State Board of Education meeting, one member was clearly channeling the Duke. Lee Baxter, a retired major general, echoed Rep. Smalley’s call for Janet Barresi to resign from office immediately. As reported in the Tulsa World,
“I want the venom stopped. I’m sick of the lack of collaboration and blatant disrespect for our school administrators, and I think it needs to stop soon,” Baxter said. “The way I think that needs to happen is for the state superintendent to relinquish her role now. I don’t believe that will happen.”
Baxter’s comments came at the end of Thursday’s meeting in the State Capitol. Barresi sat lock-jawed during Baxter’s comments, which went on for about five minutes.
She quickly adjourned the meeting and turned and watched as Oklahoma City board member Bill Shdeed shook Baxter’s hand and told him, “That took a lot of courage.”
Then Barresi turned to board member Bill Price of Oklahoma City and gestured animatedly with one hand and said, “He’s a son of a b—-!”
Come to think of it, many of John Wayne’s movies ended with someone calling him that, so Baxter is in good company.
We have just over three months left that we have to work with Barresi. As there was in 2011, I expect there will be many people shown the door ungraciously on the first day of a Hofmeister or Cox administration. Kim Richey and her crony husband should be in the first wave.
Baxter also rightly said that Barresi’s continued presence and antagonism taints the standards-writing process that the state now faces. Because of some of her top staff in curriculum and in assessment, school districts lack the confidence that their input will be meaningful. I suspect those positions will also turn over quickly in January.
Another reader sent me this after the SBE meeting.
As I sat in the State Board of Education meeting this morning, I tried to keep my poker face but a few times almost gasped at what I heard:
- Teachers need the SDE to instruct them in how to teach to PASS curriculum objectives in order to pass the state test.
- No one has assessments aligned to PASS, or they are not interested in doing business with the state of Oklahoma because it’s not worth their time in sheer dollars. And, no one seems to know how many testing companies there actually are.
- Schools couldn’t possibly run a new program to test the few students who really HAD to test in November. I mean, heck, that’s only six weeks away. The current OSDE couldn’t get an RFP out for the Winter Tests in three months, so I’m sure no one else could.
Really. … Actually, it was so far from reality, I could no longer look her in the eye. I was embarrassed for her because, as you know:
A. Oklahoma teachers who started teaching after September 1992 and most other successful teachers throughout our state are already aligned to PASS. The only problem they are having is helping their students prove they’ve learned what will be tested.
B. Lots of educators have formative and summative assessments aligned to PASS. More importantly, the OSDE should own a dozen years’ worth of valid, field-tested and reliable test items. Not all testing companies have been asked if they are interested.
C. In just 3 ½ years, the OSDE has become legendary at changing programs – hardware, software and bureaucratic data collection – or standards and penalties on schools, and expecting educators to make it work on a dime. Maybe some students could test in December or January. What difference should it make?
These observations are spot on. The Barresi regime has failed us, in part, because they arrogantly believe they know things that actual educators don’t know. They don’t know the truth about PASS. They don’t understand the testing process. They haven’t even released a Request for Purchase (RFP) to select a new testing company. The writing tests are five months away, if you believe the calendar for that. Every debacle of the last four years is explainable because of the SDE’s sheer arrogance.
The reader who sent me the information about the badges also sent me this note:
So, when I read about the new head of accreditation being an “investigator” who will start a new program of investigating schools, I’m with you — this is all about retribution before she leaves. It’s a good thing you stayed anonymous, although I would not be surprised if one of his jobs is to find out who you are and punish you!
I don’t talk about my anonymity much, but yes, I worry about retribution. I have sources in a variety of places. I have close friends in the profession. I don’t want a hatchet-job investigation to target me and the people with whom I most closely work. I doubt I’m public enemy number one or anything like that, but yes, the threat of retribution is a real concern.
Fearing people in positions of power who think they’re above reproach is normal.
We know that the tone at the SDE will change in January. Those of us trying to get work done have grown impatient. It can and should start now.
A Gentle Reminder: Poverty Matters
The Oklahoman has an article this morning on the front page of the paper in which officials from several suburban districts downplay the importance of the state’s A-F Report Cards. The catch is that these districts have fairly good performance. While the article itself is currently only viewable by subscribers, the graphic associated with the article is viewable to anyone. Showing Oklahoma City Public Schools and five other large districts in pie charts, we see percentages of each letter grade for each district. For the sake of comparison, I looked up the 2013 free/reduced lunch rates of these six districts as well.
| District | Schools with A or B | Schools with D or F | Free/Reduced Lunch |
| Edmond | 100% | 0% | 26.6% |
| Moore | 74% | 3% | 41.0% |
| Norman | 55% | 23% | 49.1% |
| Mid-Del | 36% | 24% | 68.9% |
| Putnam City | 23% | 23% | 75.3% |
| Oklahoma City | 20% | 64% | 86.4% |
In other words, if we were to rank the districts by overall performance, they would fall in the exact order of their poverty levels. This is no coincidence.
In previous years, the SDE has also posted a spreadsheet of school performance, which allowed me to cut-and-paste, and then align columns with another database. This year, there is no spreadsheet. And there is no need. The linkage between poverty and test scores is well-established.
Last year, I found that poverty had a strong, negative (-0.60) correlation to A-F Report Card Grades. It was even stronger than the year before (-0.44). While I wonder what the data would show this year, I’m not going to hand-enter the grades into a spreadsheet. I don’t have time for that.
Tulsa area school leaders are similarly unimpressed.
Sapulpa schools have seen sliding grades the last three years, but Superintendent Kevin Burr said what the grade card doesn’t show is the growth taking place among students at those schools.
“What we prefer to look at, which is a stronger indicator to us of whether or not we’re making progress, is an assessment that is independent of politics and manipulation of any kind, and that is the ACT (college entrance exam),” he said.
On Wednesday, the same day the state released the A-F school report cards, Burr said he learned that Sapulpa Public Schools got the highest composite ACT score in the history of the district.
“It’s beyond ironic that we face the kind of grade card speculation and scrutiny we are when in fact we’re enjoying knowing that the kids at the end of the spectrum, who we are responsible for, are being better prepared than they ever have been,” he said.
We strive for things that matter. Getting our students ready for college matters more than the state tests do. It takes teachers committed to students in Pre-K and beyond. It takes all the classes. And it takes focus, even in the face of constant political disparagement.
To those who are busy saying so – telling their communities to look away from these monstrosities masquerading as accountability – we say “thank you!”

There’s nothing to see here!
2014 A-F Report Cards: Nobody Cares
In “Assume the Position,” friend of the blog Rob Miller wrote over the weekend that we should greet today’s release of the A-F Report Cards with a collective yawn. Sorry, Rob. You know I just can’t do that. This stuff is my bread and butter…my sweet spot…my raison d’être. Inside of me is a little “researcher” who lives for identifying Type I errors in everyday life. That’s what A-F Report Cards do best!
For those of you who haven’t tested a hypothesis lately, a Type I error is, more or less, when the data leads you to detect something that isn’t there. A Type II error, then, is rejecting the presence of an effect that actually exists. The education reform movement is built upon a framework of both types of error.
With the A-F Report Cards, we are primarily looking at Type I errors though. Following the conversation of the State Board of Education today as they adopted them shows this clearly.
The second tweet refers to a report that the US Chamber of Commerce released last week giving Oklahoma’s entire education system an F. In short, they don’t like the fact that we’re not reformy enough. Here were future former State Superintendent Barresi’s comments last week:
“The Leaders & Laggards report is yet another indicator that Oklahoma’s public education system is in dire trouble. It would be tempting to label this a ‘wake-up call,’ except that alarm bells have been going off for many years.
“Oklahoma is among a handful of states that received an F in both academic achievement and academic achievement in low-income and minority students. It is clear, then, that we are doing a disservice to far too many students regardless of their socioeconomic status. This is a problem that affects us all.
“Unfortunately, many of our reforms have been watered down or weather constant attacks from defenders of the status quo. Our parents and students deserve better — much better. That means accountability, school choice and a continued focus on improved academic standards and proficiency in reading by third grade.
“We must not defer to mediocrity. This report is more evidence that PASS fails. It is beyond me why we are taking so much time reviewing the Priority Academic Student Skills, which we left behind in 2010.
“Oklahoma must move on and begin the process of writing rigorous academic standards that our children need and deserve.”
It would be shorter to list the people she isn’t insulting than to highlight the ones she is. In short, you’re screwed, Oklahoma, and you only have yourself to blame. She knows we’re tired of hearing her say these things, though.
Yes, she realizes that even the SBE is tired of hearing from her. I don’t know why she’s so glum; twenty percent of Oklahoma Republicans seem to think she’s right on target. The rest of us – Republican, Democrat, and otherwise – know differently.
The SBE also discussed an issue with how students count in a school district that works with students in a juvenile detention center. They seemed flummoxed that this was an issue.
Yes, they have to count somewhere. Let’s just give another example to show how inflexible the report cards are. One board member thinks there’s room for a tweak here.
Then he said this.
So close, Bill Price. So close. Fun fact here – the SDE is scrambling to find someone to calculate API. Additionally, for the last few years, the SDE has had the API scores that existed from 2002 through 2011 removed from its website, citing bogus privacy concerns. It’s like they have been trying to wave that thing from Men in Black in our eyes, hoping we’d forget API ever existed. I doubt anyone has actually run the correlation between A-F to find how the grades relate to API. If someone has, I’d love to see the evidence.

Not everybody was drinking the Kool-Aid, however.
Before the meeting adjourned, Barresi had one final jab at real educators.
So a day after celebrating the Oklahoma Teacher of the Year process, she has nothing but scorn for how Oklahoma administrators honor one another? That seems about right. Teachers are chosen by their peers for their site and district honors. The same is true for principals and superintendents. I guess she just can’t handle that her biggest critics have risen to the top. For their part, CCOSA had this to say.
September 17, 2014
Oklahoma City, OK – Responding to claims offered by outgoing State Superintendent Janet Barresi that disparage Oklahoma’s public school administrators of the year and the process used by CCOSA affiliate organizations to select them, Steven Crawford, Executive Director of the Cooperative Council for Oklahoma School Administration (CCOSA), offered the following comments:
“CCOSA proudly supports our past and current administrators of the year. These successful instructional leaders are nominated and selected by their peers. Our process for selecting these individuals is rigorous, member driven, and annually reviewed to ensure that our award winners are accomplished educators and excellent representatives for public education.”
As one superintendent on Twitter pointed out, the process works pretty well. Dr. Ann Caine, Stillwater superintendent and CCOSA Superintendent of the Year, leads a district with 4 As and 3 Bs. If the report cards mean something, she certainly earned. I prefer to think she deserved the honor in spite of the report cards being meaningless.
For her part, Governor Fallin also commented on the report cards.
“The A-F grading system is designed to empower parents by providing them with an easily understood measurement of how a school is performing. This year’s grades demonstrate that Oklahoma has hundreds of “A” schools and many pockets of excellence. It also continues to show – as we have known for years – that there are many schools that are struggling. The superintendents and teachers of schools receiving a D or an F must remember: a bad grade is not a punishment; it is a call to action. Parents should also understand that we are absolutely committed to helping these schools succeed in the future.
“Knowing where we have difficulties is the first step in working towards improvement. The challenge now is to rally around those schools and the students in them to improve results. That will take an all-hands-on-deck effort, with parents, teachers, administrators, and local and state governments working together.
I love how politicians continue to act as if schools didn’t use data prior to 2011. We did. Extensively. I also love how they act as if these grades aren’t punitive. They are. They have little bearing on reality, but they color public perception.
Finally, nearly five hours after announcing that the report cards would be released at 4:00 this afternoon, the SDE had them ready for public viewing.
Unfortunately, the media had them first. Oklahoma Watch posted the database earlier.
The myth of failing schools is critical for reformers. They target high-poverty, high-minority schools that struggle with not just education, but every societal ill imaginable. We’re not talking about your run of the mill Title I school. We’re talking about the poorest of the poor – the schools that are hardest to staff. These are the schools that feed the charter schools in Oklahoma. And the students there are often better for it. This is not, however, a model that lends itself to rural and suburban areas.
As I always do, I will look at the data in the coming days and show the correlations that actually exist. I will analyze the results of our state’s charter schools too.
In the meantime, I’m yawning, just as Rob said I should. It’s 1,000 words later, but I am in fact yawning.
About the Remediation Ruckus
I am proud to work in public education. That means wherever I go, I am willing to teach or support the education of any child who shows up. Yes, we teach them all. The smart ones. The well-behaved ones. The talented ones. The adorable ones. The ones who struggle. The ones who test our patience. The ones who, bless their hearts, just try so hard. The ones who sometimes are hard to appreciate. We do it because they matter – all of them.
This separates us from our friends in private schools. I don’t doubt the hard work they do. Nor do I begrudge them the working conditions they’ve chosen. In many cases, they teach for lower salaries and have less job protection than public school teachers do. The trade-offs are more parental involvement and fewer requirements to acquire their teaching positions. In any case, they teach children who have chosen to be there, and whom the school has chosen to accept. At any point, the school, if certain conditions are not met, can send them back where they came from. Public schools can’t do that; as such, comparisons between the two are rarely meaningful.
That’s why I found the Oklahoman’s foray into the discussion over college remediation rates a bit disingenuous. You’re shocked, I’m sure. The graphic below shows how they compared public schools to private schools when it comes to college remediation rates.

But who doesn’t love a stacked deck?
As you can imagine, the fact that the schools on the left are also high-poverty high schools never comes up either. Since I’m the kind of person who doesn’t like data out of context (which reminds me – A-F Report Cards are just around the corner!), I thought today was a good day to dust off the correlation machine (by which I mean Microsoft Excel) and explore the relationship between two sets of numbers. First, I would look at the high schools – all of them – and see what other statistics correlate to a school’s college remediation rate. In all, I ran 10 tests. Since there are 454 schools in the dataset, the results all maintain statistical significance.
Things Correlating to College Remediation Rate
| Free/reduced lunch % | 0.56 | Moderate, positive |
| Household income | -0.38 | Moderate, negative |
| College-going rate | -0.35 | Moderate, negative |
| Parents with college degrees | -0.33 | Moderate, negative |
| Parents not completing high school | 0.33 | Moderate, positive |
| Student mobility | 0.30 | Weak, positive |
| Absentee rate | 0.28 | Weak, positive |
| Special education percentage | 0.27 | Weak, positive |
| Single-parent families | 0.22 | Weak, positive |
| Students completing college-bound courses | 0.01 | Non-existent |
Here’s a reminder of what these numbers mean, for all of you who haven’t had a stats class in a while. All correlation values fall between zero and one (or zero and negative one). For positive relationships, the numbers go in the same direction. For example, as free/reduced lunch rates go up, so do college remediation rates. For negative relationships, the numbers go in opposite directions. For example, as household income goes up, remediation rates go down.
Based on accepted convention, none of the relationships would be described as strong. The top five variables would be described as moderate, with the two indicators of poverty ranking at the top. Interestingly, the schools with more students going to college seem to have fewer students needing remediation. I guess that indicates something about expectations. It should also come as no surprise that parental education is also a factor in college remediation rates. It would seem that first-generation college students who come from a background of poverty struggle at the beginning of college.
Just on the outside of moderate are the next four relationships. Although the strength is not as pronounced, the relationship is nonetheless there. Schools with a lot of mobility and a lot of special education students are more likely to have higher remediation rates than schools without those challenges. This makes sense, but it says a lot about the schools that these relationships are weak. Additionally, students who are frequently absent and those who come from single-parent families (two statistics that often correlate as well), tend to need remediation at higher rates too.
Surprisingly, the correlation between the percentage of students completing college-bound courses (students completing all the ACE required courses, as opposed to those whose parents opt them out of the ACE requirements) is non-existent. I’m struggling to explain this one. Maybe it means that we place too much value in taking choices away from kids. Maybe, if students had fewer required courses for graduation and more students could pursue their actual interests, we’d have more college-ready freshmen.
To make things interesting, I picked two schools from the Oklahoman’s graphic and plugged some numbers into a spreadsheet. From the 12 public schools represented on the above bar graphs, I selected two. See if you can figure out which is which from the data below:
| Statistic | School A | School B |
| Free/reduced lunch % | 18% | 81% |
| Household income | $98,568 | $44,588 |
| Parents with college degree | 51% | 18% |
| Parents not graduating HS | 4% | 16% |
| Absences per student | 8.6 | 14.6 |
| Mobility rate | 5% | 11% |
| Students in special education | 11% | 14% |
| CareerTech program participation | 16% | 68% |
| Oklahoma college-going rate | 69% | 41% |
| Out of state college going rate | 10% | 5% |
| Oklahoma college remediation rate | 15% | 55% |
Obviously, School A serves an affluent population with parents whose own experiences lead to high academic expectations. School B has a lot of poverty and mobility. More students are steered towards the career part of College & Career Readiness. Overall, though, it appears more students at School B have some sort of a post-secondary plan.
I took the easy way out. I used the school in the middle of each side of the graphic. School A is Edmond North High School. School B is Muskogee High School. If you want, you can look up data for any school in the state. The more information you have, the more complete your picture is.
When any reasonable person knows the whole story, simple accountability measures, such as the A-F Report Cards, just don’t impress. Muskogee High School, for all the challenges faced by the students and teachers there, seems to have the vast majority of their students thinking about something after high school. And that is why we’re here.
Whether the State Regents decide to certify PASS as C&CR…whether the USDE gives us back our waiver at some point…whether Congress eventually rescinds No Child Left Behind (which is long overdue), we have high schools all over this state, serving all kinds of student populations, that are helping children prepare for life after the PK-12 world we occupy. Career Tech is part of that picture. So is college. And so are choices that can’t be captured statistically. That doesn’t make them less valid or meaningful.
Yes, Mr. Nelson, it is a Big Deal!
Thursday’s announcement that Oklahoma has lost its No Child Left Behind Waiver was a bombshell that we knew was coming, ever since Governor Fallin signed HB 3399 into law in June. On the day before Fallin signed the bill, the SDE made a presentation at the CCOSA conference explaining what would happen if we lost the waiver. Then in July, at the Vision 2020 conference, the SDE gave a more polished presentation explaining what would happen. Two pieces are most relevant to many Oklahoma schools.
First, under the provisions of the waiver, Oklahoma has not had to reach the unrealistic targets that go into effect this year, established by NCLB in 2001. Instead, accountability has been determined by our A-F Report Cards since 2012, as well as by obscure targets for three specific student populations (Hispanic, black, and special education). Without the waiver, our soon-to-be report cards mean even less than before. They are merely window dressing. They have no teeth.
Second, without the waiver, Oklahoma will go from having about 400 schools on the various improvement lists to about 1600 – although the SDE says they haven’t run the numbers yet. Because of the targets for every single sub-group of students, we will have many A and B schools on the needs improvement list. If those aren’t mixed signals, I don’t know what are. For the schools receiving Title I funds, this will likely limit how that money is spent, beginning with next year.
Rep. Jason Nelson, who authored HB 3399, was quick to understate the impact of losing the waiver.
“I don’t think it’s a big deal,” Nelson said. “I think the big deal is the fact that you’ve got the federal government trying to exert this kind of control. In terms of what practically is going to change here as a result of that, I think is not a big deal.”
“Not much is changing. There is no loss of money. They’re not even going to require the set-aside of the 20 percent of the Title 1 funds for use by parents to do tutoring. I really think it’s a non-event.”
Asked whether teachers would have to be laid off, Nelson said, “I have no reason to think that. There is no loss or set-aside of funds.”
He said despite the loss of the waiver, he thinks passage of the bill to end Common Core without having new academic standards to replace it was the right thing to do.
“Since education is uniquely a state issue, I think it’s in the best interest of the state to do what’s in the best interest of our education system without deferring to Secretary (Arne) Duncan. So from that perspective, I think we did the right thing.”
To those of us who work in those schools, it is quite a big deal. Eligibility for Title I services is determined by the percentage of students eligible for free/reduced lunch. Depending on the depth of a school’s poverty and the size of the school, a Title I program might provide enough funds for more than one staff position. It also might barely fund one position. If we automatically hold 20 percent off the top, there will be schools that have to cut staff. Yes, Secretary Duncan delayed that requirement for a year, but it is a real possibility for 2015-16.
Our elected leaders may not realize this, but the Title I teachers in our schools are real teachers. They work with children. They may manage the Title I program for the school – including budgets, forms, and paperwork – but they also provide individual and small-group instruction for struggling students. The Title I budget provides instructional materials and gives schools funding for before and after school tutoring, as well as summer school. All of that will be jeopardized with the 20 percent set-aside.
In place of these things schools will lose will be only two allowable expenses. First is school choice – students will be able to choose a transfer to a school that actually made Adequate Yearly Progress under the old provisions of NCLB. Since the SDE only expects 10 percent of schools to make AYP, parents won’t have many options, if any. Second is the utilization of Supplemental Educational Services. There is little regulation of SESs. If an entity goes through the process to be on the state’s approved list of SES vendors, then parents can choose them. Schools have no say in this. And there is no accountability over the SESs for the results of their students. It’s a wild, wild, west of vendors.
More than likely schools will have to cut staff and set aside funds for nothing. If the money is used at all, based on prior experiences with SESs, it will be wasted. As usual, this will only impact high-poverty schools.
Nelson, to his credit, always engages his critics. His logic is often mind-boggling, but at least he shows up, as he did last night on Twitter for the weekly #oklaed chat. His purpose seemed to be to convince his audience that although losing the waiver isn’t that big of a deal, it represents HUGE federal overreach by Duncan and President Obama. His singular supporting evidence is Section 9401 of the ESEA – which specifically mentions waivers. In Nelson’s mind, since the statute does not specifically mention standards, the USDE had no right to revoke our waiver based on us dropping the Common Core in favor of standards that have not been certified as College & Career Ready.
Although the section does not mention specific requirements to adopt C&CR standards, the link to state standards is fairly clear.
(b) REQUEST FOR WAIVER-
(1) IN GENERAL- A State educational agency, local educational agency, or Indian tribe that desires a waiver shall submit a waiver request to the Secretary that —
(A) identifies the Federal programs affected by the requested waiver;
(B) describes which Federal statutory or regulatory requirements are to be waived and how the waiving of those requirements will —
(i) increase the quality of instruction for students; and
(ii) improve the academic achievement of students
While I’ve repeatedly said that teachers matter way more than standards do, the fact that Arne Duncan feels differently is no secret. Back in 2011, when we applied for our waiver, the USDE gave states two options for standards:
| Option A | Option B |
| The State has adopted college- and career-ready standards in at least reading/language arts and mathematics that are common to a significant number of States, consistent with part (1) of the definition of college- and career-ready standards. | The State has adopted college- and career-ready standards in at least reading/language arts and mathematics that have been approved and certified by a State network of institutions of higher education (IHEs) consistent with part (2) of the definition of college- and career-ready standards. |
This is pretty straight-forward. Option A gave us the option to adopt the Common Core, which we had already done in 2010. We were not lured into it by the waiver request. Option B gave us the option of going our own way, so long as the State Regents approved of the way we chose. Since we switched from A to B on a dime this summer, the Regents were pressed to certify that PASS – the standards we dumped in 2010 – were good enough that students meeting them would not require college remediation.
The May 2013 version of the State Regents Annual Student Assessment Report (the most recent version posted to their website), is a good place to look for information on how the state’s colleges and universities place students into remedial classes.
The purpose of entry-level assessment is to assist institutional faculty and advisors in making course placement decisions that will give students the best possible chance of academic success. Beginning in fall 1994, the State Regents implemented a required score of 19 on the ACT in the subject areas of English, mathematics, science, and reading as the “first-cut” for entry-level assessment. Students may also demonstrate curricular proficiency by means of an approved secondary assessment process. Students are enrolled in developmental courses after being unable to demonstrate proficiency in one or more subject areas. These courses are below college-level and are not applied toward degree requirements. A supplementary per credit hour fee is assessed to the student for these courses.
The easiest way to understand this is that students who score at least a 19 on each of the four sections of the ACT are clear of remedial courses. While each institution may have different requirements, it is also important to note that remediation is not the same across all subjects.
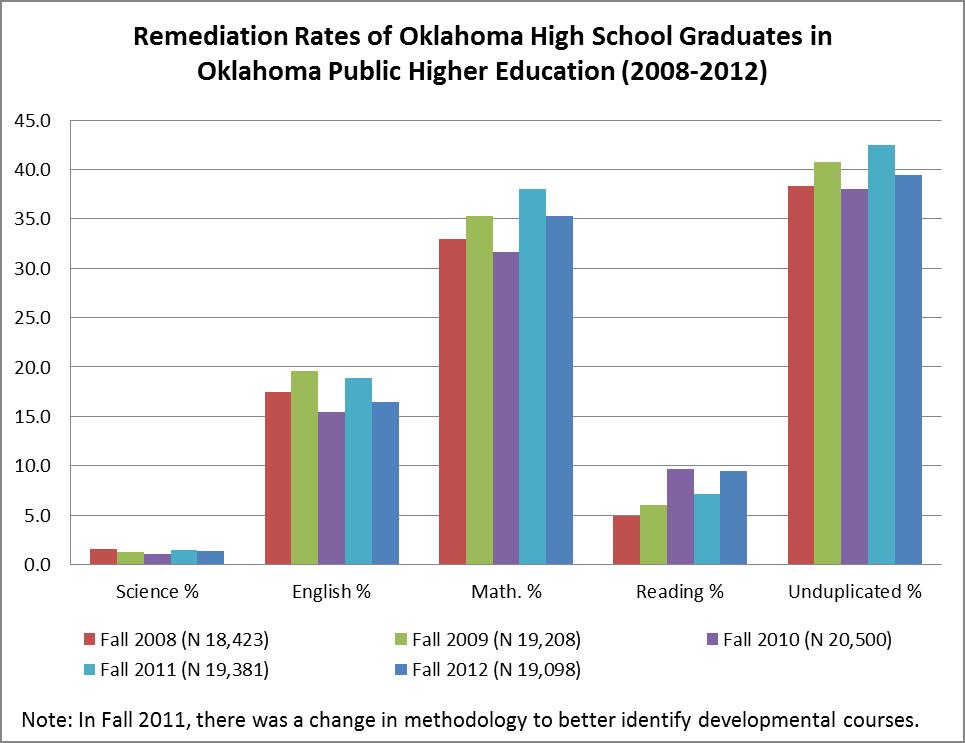
Over five years, the math remediation rate hovers between 30 and 40 percent. The reading remediation rate is close to 10 percent. (I guess we mastered that whole reading to learn thing even without third-grade retention!) This is really a math problem, not an overall preparedness problem.
Look at the chart again: what does the remediation rate really tell us about C&CR? Can you be ready for college and not major in math? Absolutely. Should we as a society value math more than we do? No doubt. Besides, this is just college. What metric does the state or the USDE use to measure career-readiness? Oh yeah, they don’t have one. Again, it’s not the standards that determine C&CR. It’s the teachers. And maybe the students. Let’s not forget the most important people in our schools.
Taking a slightly different approach, Rep. Josh Cockroft posted to his blog today his own thoughts on where losing the waiver leaves us. He starts by chastising us for choosing sides and blaming either the state or the feds for landing us in this predicament. He then blames the feds.
With the news this past week that the federal government denied the extension of Oklahoma’s Elementary and Secondary Act (ESEA) No Child Left Behind waiver, the finger pointing immediately began. Democrats like House Minority Leader Scott Inman blamed all Republicans for their “abysmal” record on issues in education like common core and education budgets which resulted in the federal decision. Republicans like Governor Mary Fallin blasted the federal government for “playing politics” with our children’s education. As with many decisions which are handed down from Washington, D.C., the lines of partisan politics have quickly been drawn. To my fellow colleagues on both sides of the aisle, public servants, and educational organizations who have had these type of responses, I have a simple message: Stop it. We must stop playing politics with our future, because our children deserve better.
Instead of drawing lines between political parties, shouldn’t we be looking towards the best interests of the children who are affected by these decisions? Why don’t we start talking about the failing schools across Oklahoma and not just skip over the students being swept under the rug for an agenda’s sake? These aren’t policies we are talking about, they’re lives. They are our future. Perhaps if we took a step outside of political halls and into the classrooms of the real world we would start to see this reality. Unlike the perception which the analysts and political talking heads will have us believe, having a locally controlled education system with rigorous academic standards is possible. It begins with proper recognition of the role of government and the will of the people whom those in public service represent.
If anything, those who have sharply pointed fingers at each other across Oklahoma’s political landscape should instead direct blame towards a federal government which is grossly overstepping its bounds of responsibility. It is overtly apparent this decision comes as a political punishment for the repeal of common core this past spring by the Oklahoma legislature; something a massive majority of Oklahoma parents were pleading for. Allowing bureaucrats in Washington to dictate our educational landscape in Oklahoma is unacceptable whether you are Republican or Democrat. I believe in our parents, teachers, and administrators much more than career politicians in D.C.
Now these decisions are in the past and we must work towards a brighter future. The reality is that we have lost the waiver. That was today; what about tomorrow? Shouldn’t our failing schools and failing grades gain as much focus as political headlines? No matter what your feelings are on the A-F school grading system and what your individual school’s grade is, you have to be blind to not see room for improvement in our schools. Let’s focus on that.
To my Democratic colleagues: Using this decision to spread the fear of lost funds among lawmakers and teachers alike is misleading and dishonest. This decision doesn’t change anything for funding levels. The federal government did not even state that there would be the 20 percent of Title 1 funds set aside for tutoring by parents, forcing the state to lose flexibility as has been incorrectly rumored. Additionally, to demand additional support from the federal government is completely hypocritical to the cries coming from your caucus over the last four years for “more local control”. You can’t have it both ways.
To my Republican colleagues: The party of less government and conservative principles cannot pause in its fight to point out the proper roles of the federal, state, and local government. If you believe in less government, fight for it! Unfortunately, many within the Republican party today are not controlled by ideas, but by the desire to be in control. This is a posture which creates little motivation for bold change. The public is looking for bold change, not the hard-to-control desire for power in our system today. Not political winds, nor contributor’s dollars, should sway the truth one way or the other. Never apologize for doing what you believe to be right.
Rep. Cockroft, which definition of “failing schools” do you accept? Is it the narrative of the A-F Report Cards, or the reality of Oklahoma’s return to the policies of George W. Bush? I’m sorry you’re upset, but I blame both parties. And I blame both levels of government.
I agree that blame doesn’t move us forward, but you all know I can’t just let a false narrative guide public policy decisions. Nobody in power (Fallin, Barresi) hated the Common Core until popular opinion turned. Oklahoma willingly wrote our waiver application with pride in having adopted the standards. We knew that we had to meet all provisions of the waiver to keep it. We chose a different route.
For the next few months, we still have a state superintendent who will go on Flashpoint and claim that the valedictorian from a high school in Edmond would be a middle-of-the-pack student nationally. (This was right after Mike Turpin asked Barresi whether she lost the election because of the message or the messenger.) This claim is nonsense. I’m guessing that many of our high school valedictorians score more than 10 points above the national average of 21 on the ACT.
Those in power still falsely insist that our schools are failing. What they mean to say is that we have schools in which students coming from the worst living conditions have low standardized test scores. What they mean to say is that schools are bad for not completely making up for the learning that doesn’t occur in some homes from birth to age four. They’re saying that privatizing public education would work better.
Going all the way back to 2001, we have been faced with education reformers who haven’t put the tim e into shaping the lives of children. The architects of NCLB, President Bush and Senator Kennedy, are the products of elite private schools. They’ve never taught the 90 day kids – and if you don’t know what that means, ask a Title I teacher or principal.
As we look to pull ourselves out of this mess, we shouldn’t minimize the frustration of the people actually invested in the schools by saying this decision – this inevitable decision – isn’t a big deal. All you’re really saying at this point is that it won’t affect you, Mr. Nelson.
